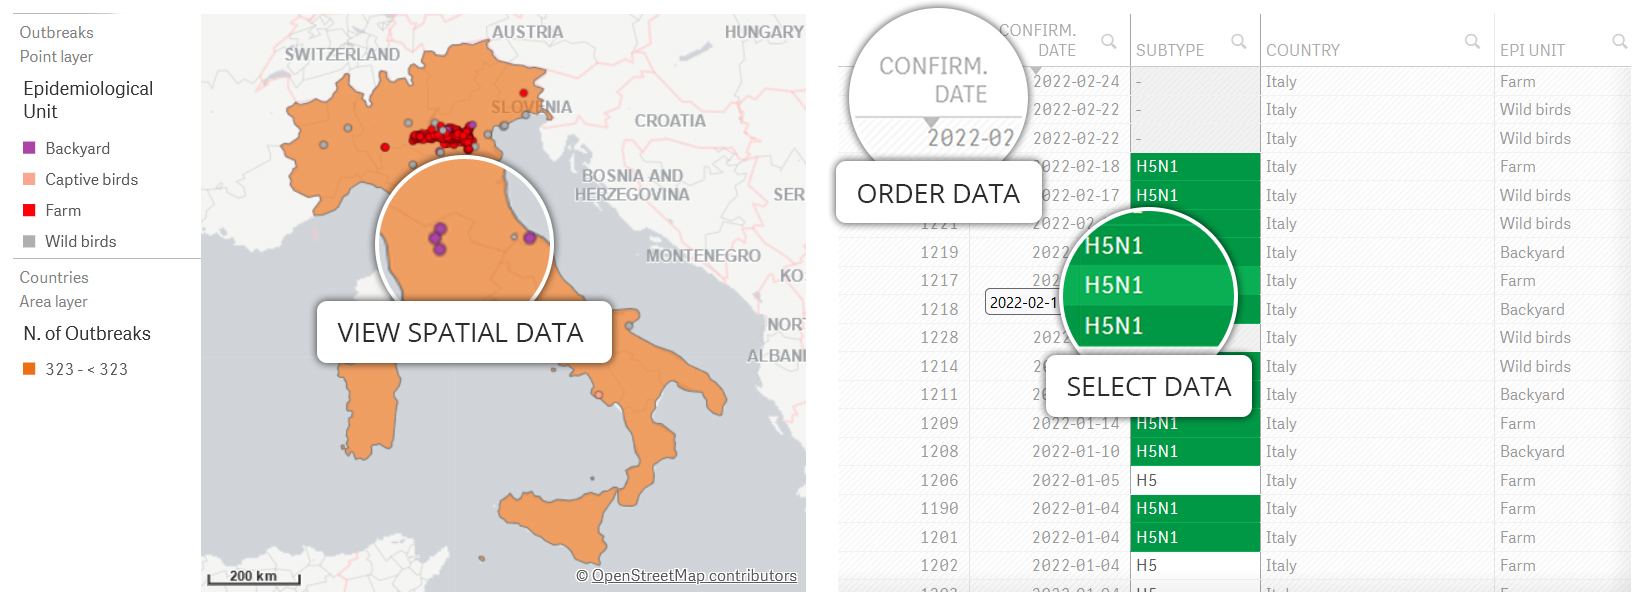

General situation
The total number of avian influenza cases notified by each Member States/Reporting Countries in different epidemiological units (commercial poultry farm, backyard farms, other captive birds and wild birds) is shown in the map below, complemented by a table that contains key information about each outbreak.

It is possible to visualise the dynamic map with a time slider displaying the temporal evolution of the HPAI cases according to the filter(s) applied.
Epidemiological details
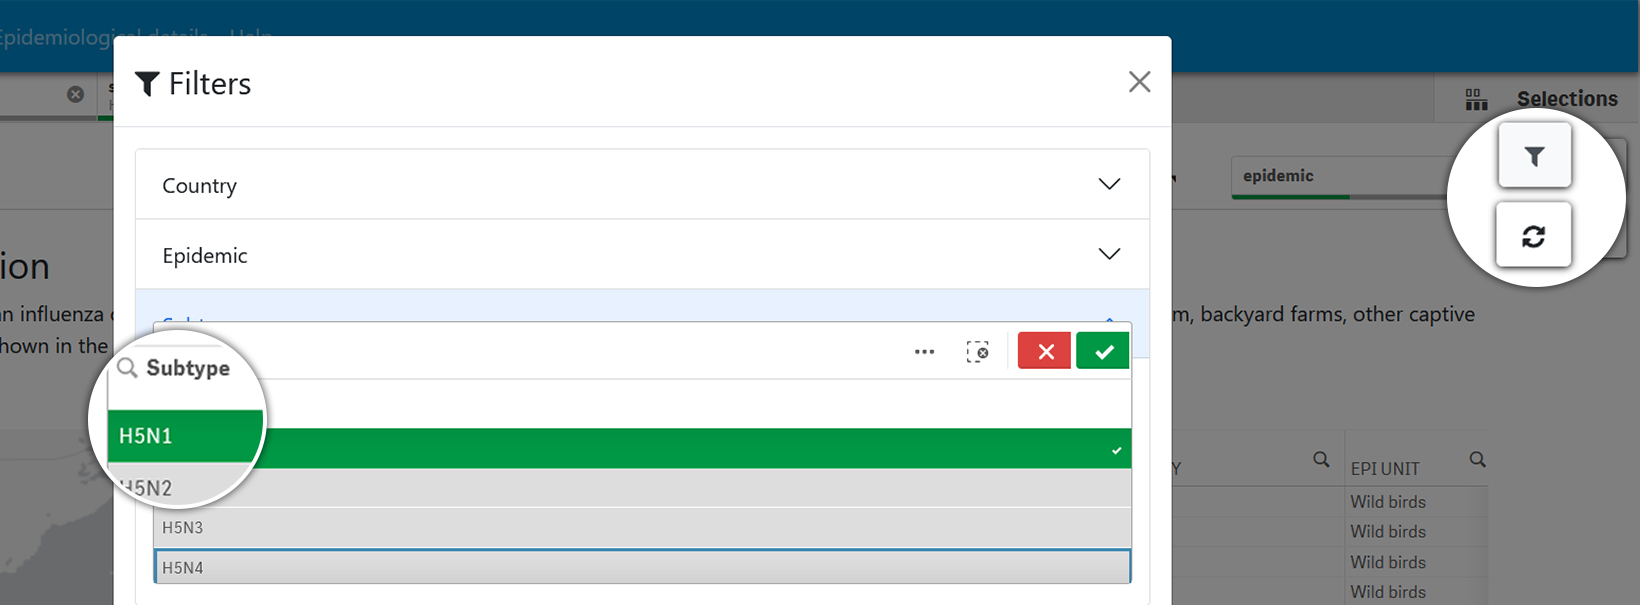
For each season, the epidemiological curve is shown by week of confirmation (dates indicate the first day of the week) and affected epidemiological units.Filters can be applied to visualize geographical distribution and temporal pattern by key characteristics of outbreaks (e.g. species affected, country, date, virus subytpe).
Poultry and Captive birds
N. of poultry and captive birds outbreaks, with detailed information on the species.
Farms, Backyard, Captive plot
Species pie chart
Wild birds
Detailed information on species and n. of animals, with specific reference to subtypes for wild birds cases.